
CAC 40 Ends Session Higher
The French benchmark finished the day up 0.60% at 8,323.28 points, with an average turnover of €3.467 bn.
Paris’ market rose on the back of a broad‑based rally in the United States and Asian equities. Investors remain focused on corporate earnings releases and the upcoming U.S. jobs report for January, which will shape market sentiment this week.
Geopolitically, dialogue between Washington and Tehran on the nuclear programme has resumed, but the tone stays cautious. Tehran doubts Washington’s willingness to reach a lasting deal, while the United States keeps pressure on with continued sanctions. This uncertainty adds a modest geopolitical risk premium that keeps Brent crude above $67 per barrel.
On the equity side, STMicroelectronics led the Paris index, jumping 9.76% to €27.32 after strengthening its partnership with Amazon Web Services. In contrast, Capgemini slipped 1.47% to €113.70 despite announcing an expanded strategic alliance with Google Cloud, which will bring AI‑driven services such as Vertex AI and Gemini Enterprise to its clients.
February Futures Outlook
Key resistance levels: 8,311 pts, 8,338 pts, 8,399.5 pts, 8,470 pts.
Support zones: 8,274.5 pts, 8,247 pts, 8,216 pts, 8,182 pts, 8,116 pts, 8,045.5 pts, 8,014.5 pts, 7,963 pts, 7,904 pts.
Intraday bias remains bullish as long as the index stays above the 8,298‑point threshold.
Technical Picture
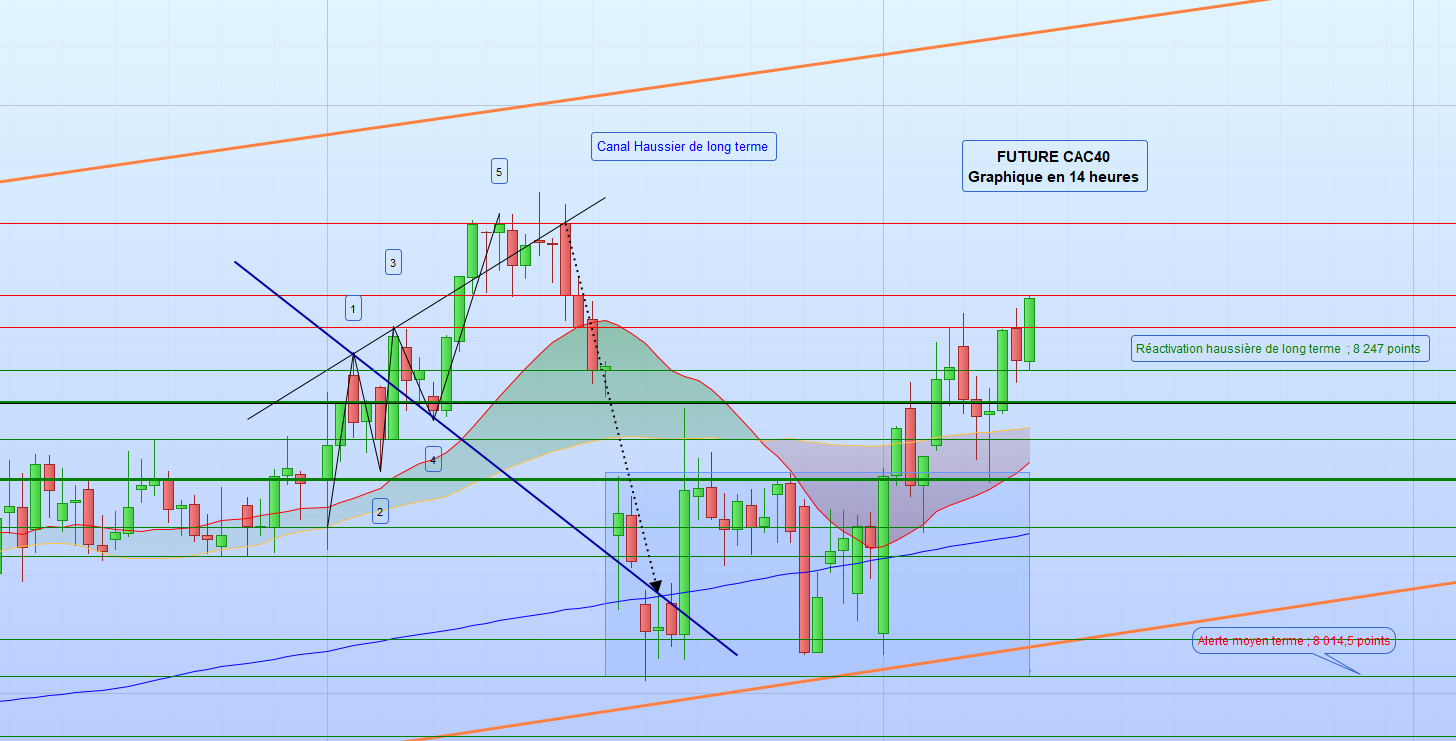
As of 14:00, the CAC 40 futures are locked in a long‑term upward channel that has been in place since April 2025. Five contact points have already validated the pattern. A clear break above the intermediate resistance at 8,311 pts would reinforce the bullish bias, especially after three consecutive closes above that level.
Should the market lack fresh catalysts or disappoint on earnings, the index could retreat to its historic trading corridor between 8,030 pts and 8,162 pts, signaling a pause in buying pressure and a resurgence of sellers. A dip toward the lower edge of the channel around 8,014.5 pts is plausible, but as long as that area holds, the underlying trend stays positive.
A decisive break below the 8,014.5‑point support would trigger a technical warning, potentially steering the index toward deeper supports at 7,731 pts and 7,603 pts – former zones of congestion.
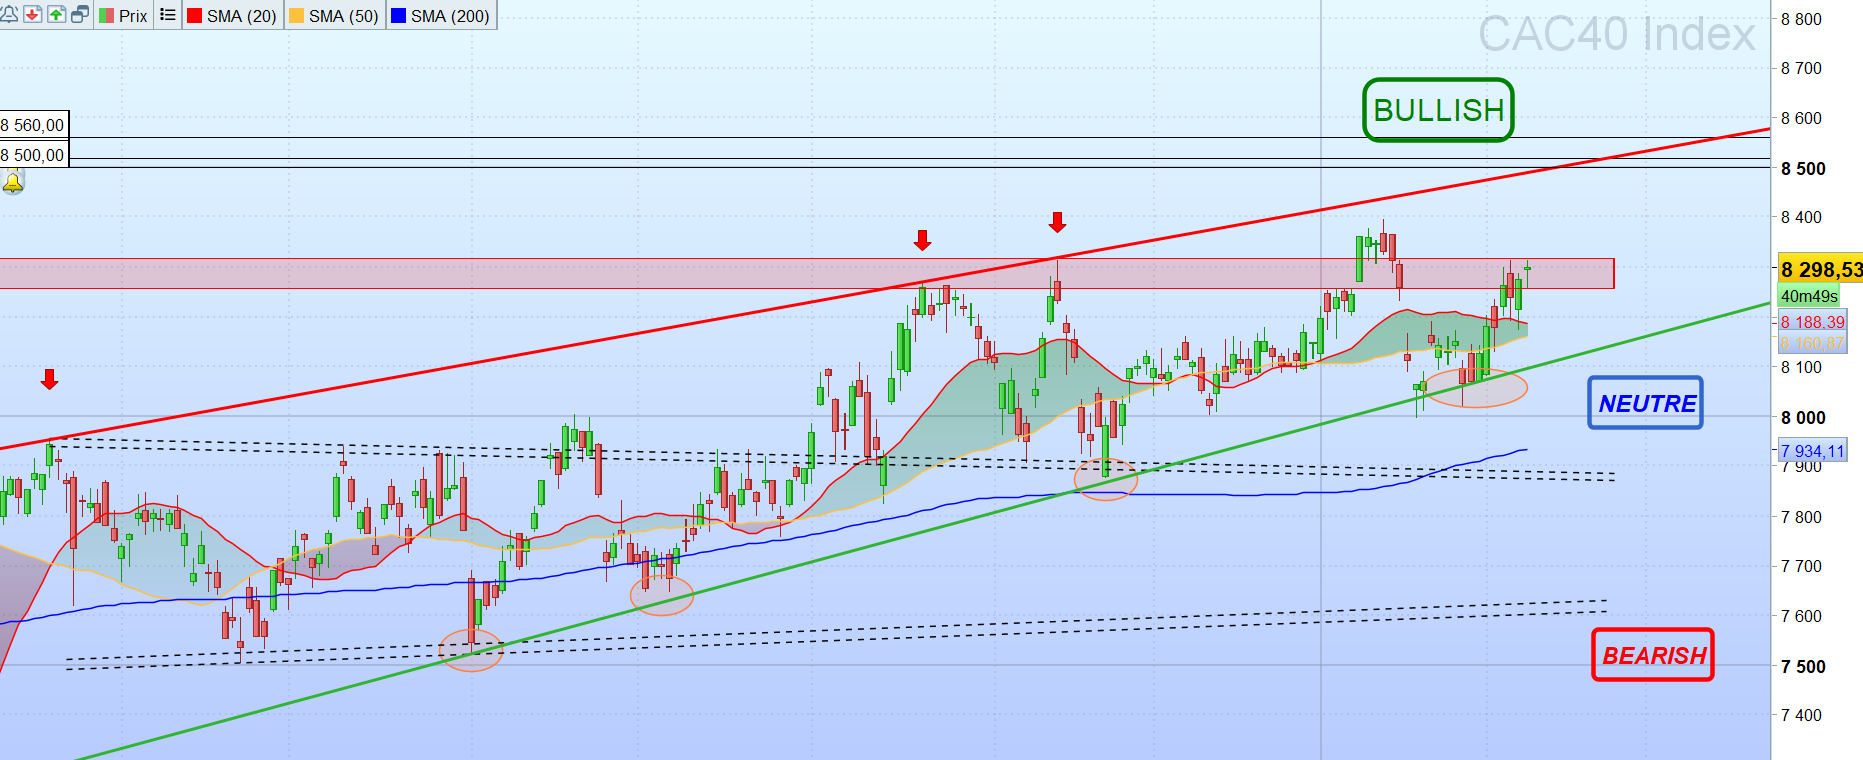
Momentum indicators are still in the green: the index trades above its 20‑, 50‑ and 200‑day moving averages, the MACD histogram stays positive, the RSI hovers near over‑bought territory, and volumes have softened compared with the previous session.
In summary, we closed all speculative long positions in our dynamic portfolio near the 8,311‑point resistance to lock in gains. Moving forward, we will continue to overweight the Dynamic and Investor portfolios with a stock‑picking approach based on clear chart signals, maintaining equity exposures of roughly 62% and 72% respectively.