CAC 40 Closes Lower, Week Ends With Modest Gain
The French benchmark slipped 0.35% to finish at 8,311.74 points on a turnover of €5.3 bn, while the weekly chart shows a modest 0.46% rise.
Paris markets lacked a clear directional push this week, as investors balanced profit‑taking with fresh monetary expectations. A disappointing organic growth figure for L’Oreal (‑4.93% to €372.35) weighed on sentiment, highlighting a slowdown in the luxury segment and weaker demand in Asia.
Across the Atlantic, January inflation came in just below forecasts, keeping the possibility of a Federal Reserve rate‑cut cycle in the second half of the year alive. Yet, a still‑robust jobs market encourages the Fed to tread carefully on the timing of any rate reductions.
In this climate of uncertainty, global volatility has ticked up. Investors are favouring selective, risk‑managed strategies and keeping a close eye on pivotal index levels.
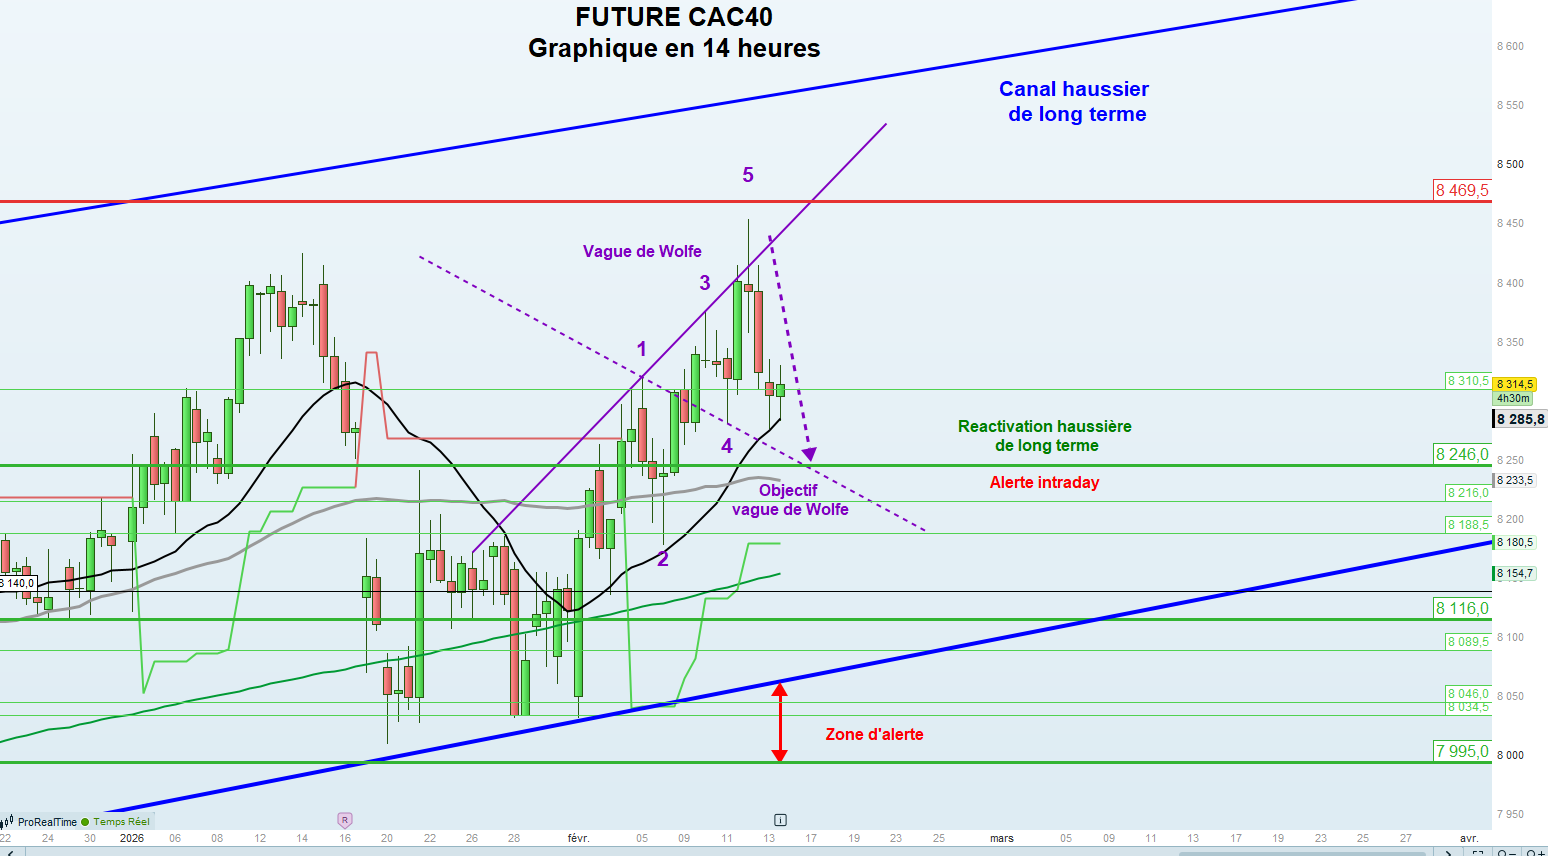
February CAC 40 Futures – Key Levels
Resistance zones: 8,469.5 pts, 8,672 pts, 8,896 pts, 9,188 pts, and 8,374 pts.
Support zones: 8,310.5 pts, 8,246 pts, 8,216 pts, 8,188.5 pts, 8,150 pts, 8,116 pts, 8,089.5 pts, 8,046 pts, 8,034.5 pts, 7,995 pts, 7,917 pts, 7,867.5 pts, 7,817.5 pts, 7,770 pts, 7,606.5 pts, 7,548 pts, 7,456.5 pts, 7,303.5 pts, 7,134.5 pts, and 6,910 pts.
Intraday, the market is holding above the 8,246 pt support, indicating a bullish bias for the short term.
Technical Narrative – Wolfe Wave Confirmation
The 14‑hour futures chart confirms a classic Wolfe wave pattern, closing beneath the diagonal that links points 1 and 3. This break validates the projected target derived from the line joining points 1 and 4, confirming the anticipated impulse move.
As long as the price respects the 8,246 pt long‑term re‑activation threshold, the market retains its upward momentum toward the upper edge of the long‑term bullish channel at roughly 8,560 pts. A decisive breach of that level would dismantle the prevailing triple‑top formation that has persisted since May 2024 and could open the path to a new rally targeting the 9,374 pt theoretical ceiling.
What If the Trend Reverses?
Should the intraday alert level be broken, the index would likely slide toward the lower boundary of the bullish channel around 8,064 pts. Maintaining the upward‑sloping diagonal keeps the medium‑term outlook positive. Conversely, a drop below the 8,064–7,995 pt alert zone could accelerate the downside, steering the price toward the strategic support zone between 7,606.5 pt and 7,548 pt. Below that, the market would seek the “neckline” of the triple‑top at approximately 7,134.5 pts.
Risk Management Summary
We trimmed exposure near the 8,469.5 pt intermediate resistance and reinforced our risk discipline. The Investor portfolio was partially hedged with BX4 contracts, while the Dynamic portfolio leaned on more speculative instruments aligned with its risk profile. Ongoing monitoring of the identified chart levels will guide any gradual re‑entry, contingent on validated reversal signals.