The CAC 40 cash index slipped 0.29% to close at 8,238.17 points, trading on a hefty €4.471 bn volume.
Paris’s equity market fell after the European Central Bank confirmed its policy rates – a 2.0% deposit rate and a 2.15% refinancing rate – stayed unchanged. Inflation in the eurozone has been hovering near the 2% target for several months, yet the ECB warned of lingering geopolitical tensions, trade frictions and fragile economies, underscoring a pragmatic, case‑by‑case stance.
Earnings drove the day’s moves. BNP Paribas rose 1.15% to €91.98 after posting results that modestly beat forecasts for its 2025 fiscal year. ArcelorMittal jumped 3.09% to €49.01 on a strong earnings report and an upbeat outlook for 2026. In contrast, Stellantis dropped 5.69% after delays in its Peugeot models linked to battery‑plant setbacks.
February Futures Outlook
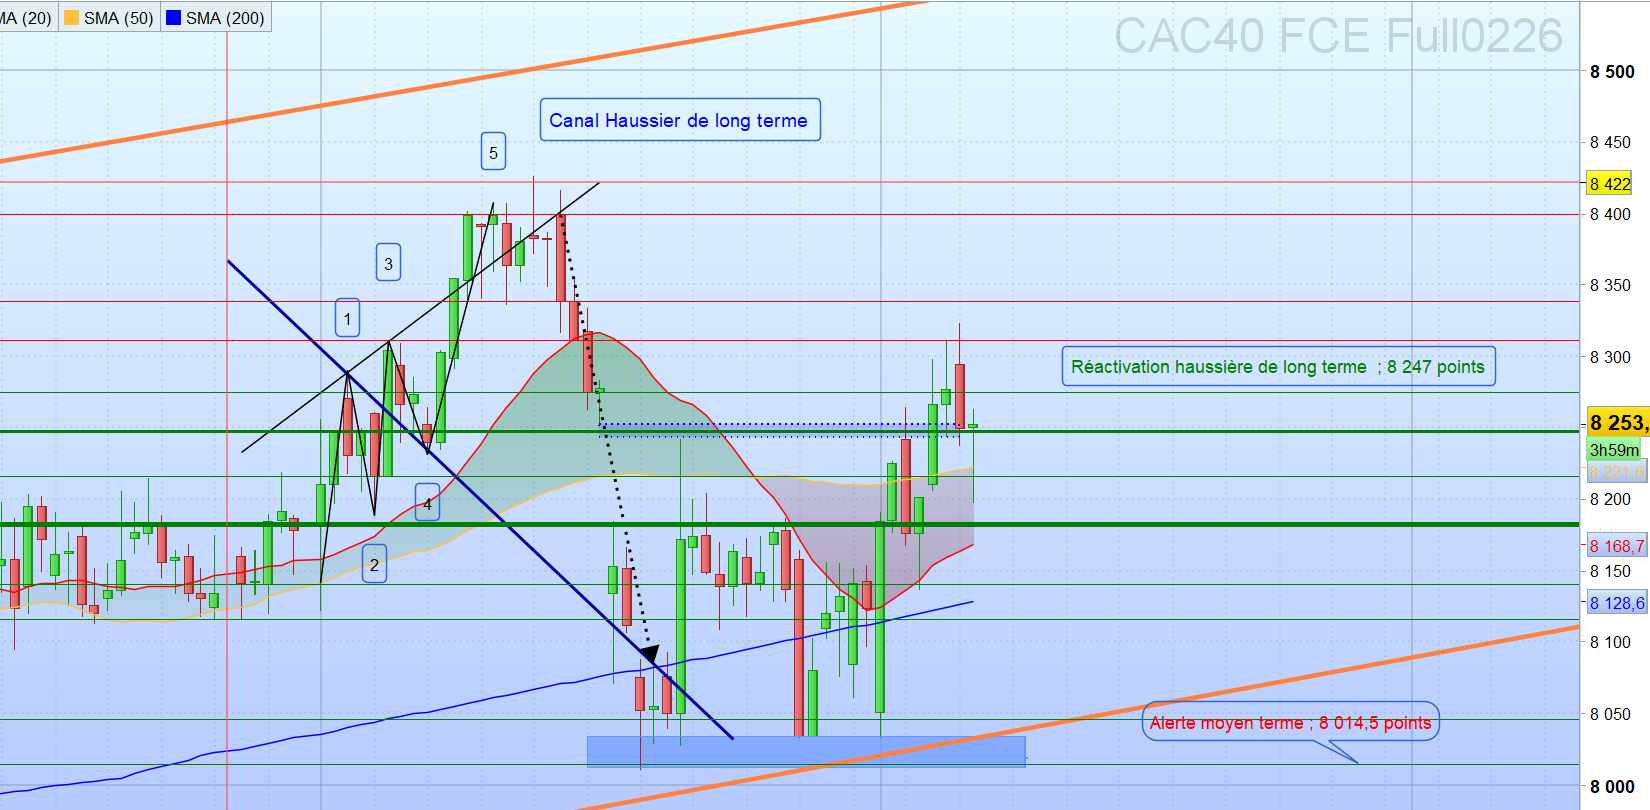
Resistance levels: 8,311 – 8,338 – 8,399.5 – 8,470.
Support levels: 8,274.5 – 8,247 – 8,216 – 8,182 – 8,116 – 8,045.5 – 8,014.5 – 7,963 – 7,904.
The intraday bias remains bullish as long as the index stays above roughly 8,198 points.
Technically, the February CAC 40 future formed a classic “hammer” candle on a volatile, high‑volume session. The pattern gains credibility only if subsequent candles close above the hammer’s high for at least three consecutive sessions. The 8,247.5‑point zone has been tested repeatedly and could act as a springboard for a longer‑term upside. A confirmed break above this level would open the path toward the 8,311 and 8,338 resistance zones.
Conversely, a lack of catalysts or disappointing earnings could pull the index back into its previous narrow range of 8,030 – 8,162 points, signaling waning buying momentum. In that case, a move toward the lower bound of the up‑trend channel near 8,014.5 points would not be surprising. As long as that support holds, the underlying bullish structure remains intact; a decisive break below would likely trigger a deeper consolidation toward historic support zones around 7,731 and 7,603 points.
On the indicator side, the index trades above its 20‑, 50‑ and 200‑day moving averages. The MACD histogram is rising but still sits below the signal line, while the RSI hovers in neutral territory. Trading volume has softened compared with the prior session.
To lock in gains, we trimmed a portion of our Investor portfolio and are reinforcing both the Dynamic and Investor baskets through disciplined stock‑picking, guided by emerging chart patterns.