The Paris‑based CAC 40 cash index closed 0.61% lower at 8,062.52 points, with €3.878 billion changing hands during the session.
The French market continued a lingering consolidation, slipping to a six‑week low as geopolitical friction resurfaced. Recent discussions over Greenland’s resources and a fresh wave of U.S. tariffs on European goods have revived risk‑aversion across Europe.
Former President Donald Trump reignited his criticism of French wines and champagnes in response to President Emmanuel Macron’s opposition, adding another layer of uncertainty. The heightened political rhetoric nudged investors toward traditional safe‑havens, sending gold and silver to fresh record highs.
Across the Pacific, Japanese long‑term yields surged past the 4% mark for 40‑year bonds after a budget announcement that markets found opaque. This sudden spike compounded the pressure on European equities.
In Brussels, policymakers are weighing a €93 billion retaliatory package targeting U.S. imports, while EU leaders are set to convene an extraordinary summit to chart the bloc’s next steps. Markets now await a definitive ruling from the U.S. Supreme Court on America’s trade agenda and a possible appearance by Trump in Davos later this week.
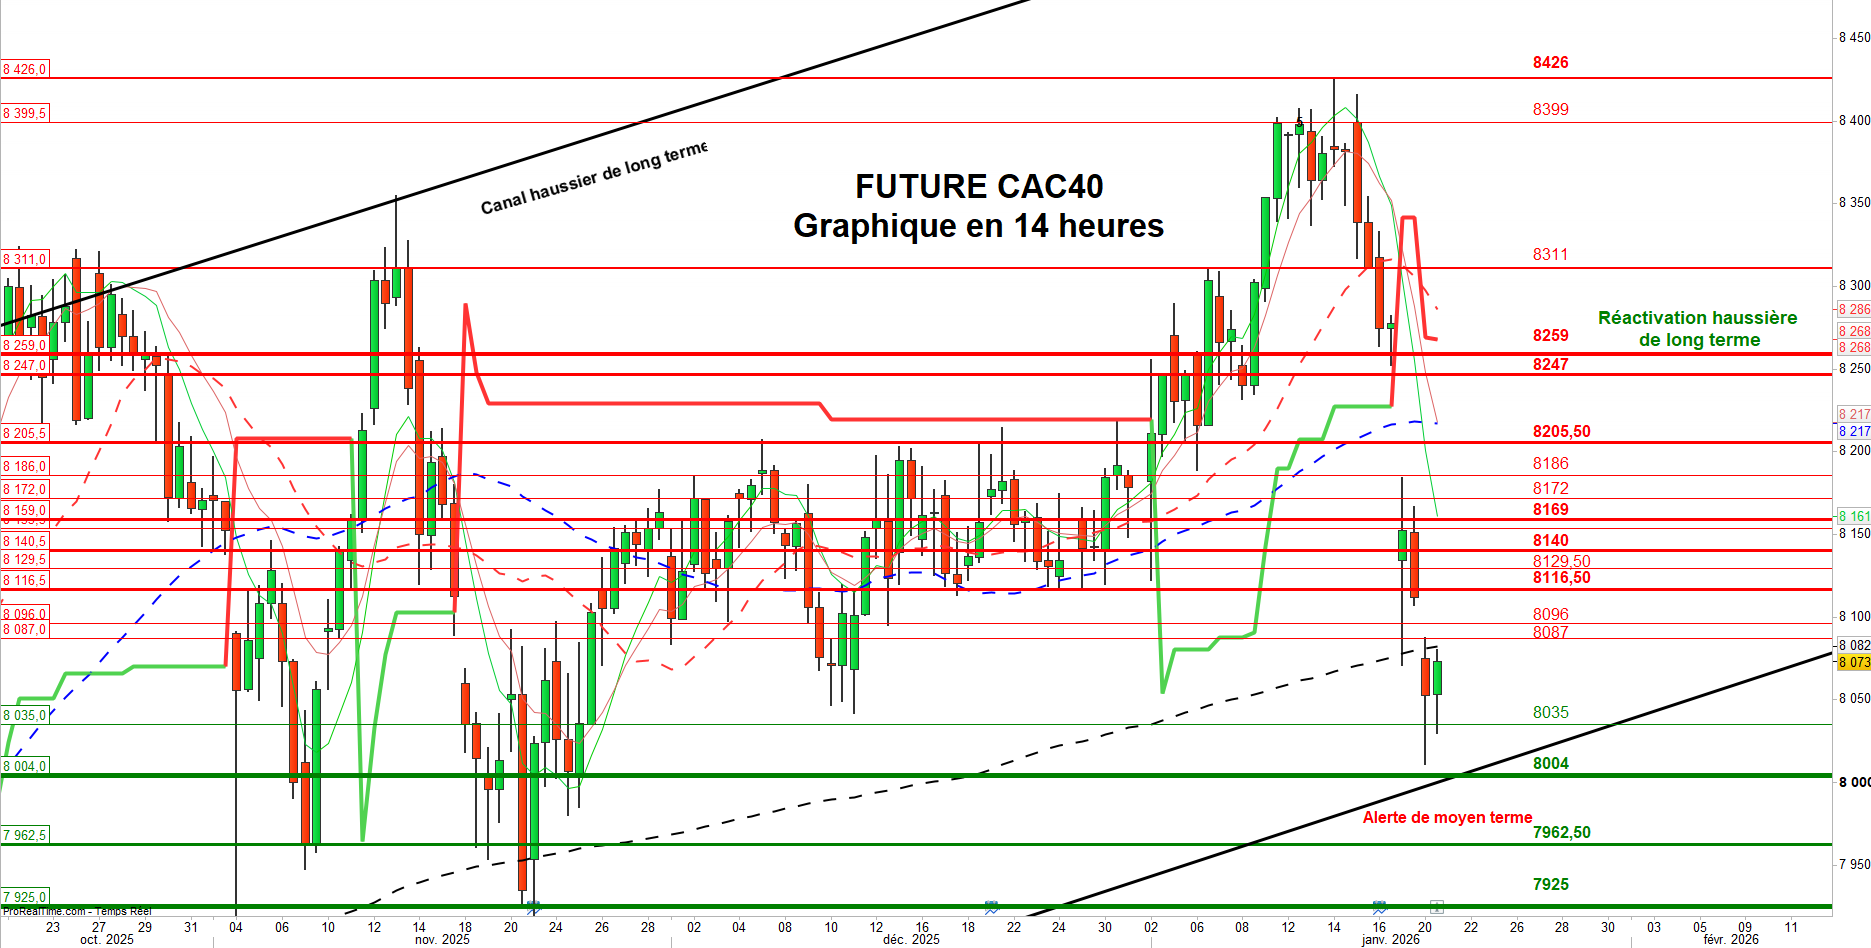
Technical Outlook on the February CAC 40 Future
Resistance levels to watch: 8,087 – 8,096 – 8,116.5 – 8,140 – 8,169 – 8,186 – 8,247 – 8,259 – 8,310.5 – 8,469.5 – 8,672 – 8,896 – 9,188 – 8,374.
Key support zones: 8,035 – 8,004 / 7,970 – 7,917 – 7,867.5 – 7,817.5 – 7,770 – 7,606.5 – 7,548 – 7,456.5 – 7,303.5 – 7,134.5 – 6,910.
Intraday momentum remains bearish below the 8,266 point mark. The futures chart stayed under pressure, confirming the down‑trend that began earlier in the week. A second bearish gap opened between 8,092.05 and 8,062.58, extending the gap‑driven sell‑off that started on January 19.
This series of gaps signals persistent selling power and underlines the short‑term downside bias. The index briefly tested a major support around 8,010 before rebounding slightly, but a technical bounce alone is unlikely to reverse the trend. Only a full closure of the January gaps could clear the path toward the next resistance corridor between 8,400 and 8,459 points.
Regarding indicators, the MACD histogram remains expanded, suggesting the down‑trend still holds sway. The RSI sits in oversold territory, while volume stays above its average, confirming the strength of the sell‑side pressure.
Conversely, a decisive break below the medium‑term alert zone—anchored by the lower edge of the long‑term upward channel—would deepen the bearish case. Should the index trade beneath the 8,004‑7,970 support range for three consecutive sessions, the next significant target could be the 7,605‑7,548 zone.
To conclude, partial profit‑taking has been executed on the “Dynamic” and “Investor” portfolio coverages after reaching their technical objectives. The “Dynamic” allocation is being increased cautiously, guided by selective technical signals. Nevertheless, any substantial exposure lift will only be considered after a confirmed breach of the pivotal technical thresholds.