
CAC 40 Slides 0.2% as Markets Enter Adjustment Phase
The CAC 40 cash index finished the session down 0.19% at 8,313.12 points, with a turnover of €3.83 bn.
After a promising start, Paris‑based equities slipped despite solid quarterly earnings from luxury group Richemont and Taiwan semiconductor leader TSMC, announced before the market opened. This marks the fourth consecutive day of decline, following a year‑start streak of record‑setting levels.
Investors remain glued to upcoming economic releases while staying cautious amid lingering geopolitical tensions, notably around Iran and the Greenland situation. Those variables are nudging markets toward a brief consolidation after the sharp rally of the past few weeks.
Geopolitical backdrop
U.S. President Joe Biden signaled that an immediate military move against Iran is unlikely, easing the risk premium baked into oil prices. The same calm filtered into precious‑metal markets: gold, which had hovered near all‑time highs, and silver both pulled back as investors locked in profits.
The White House also paused any new tariffs on critical minerals, opting for bilateral talks on supply chains and pricing, which helped steady metal prices.
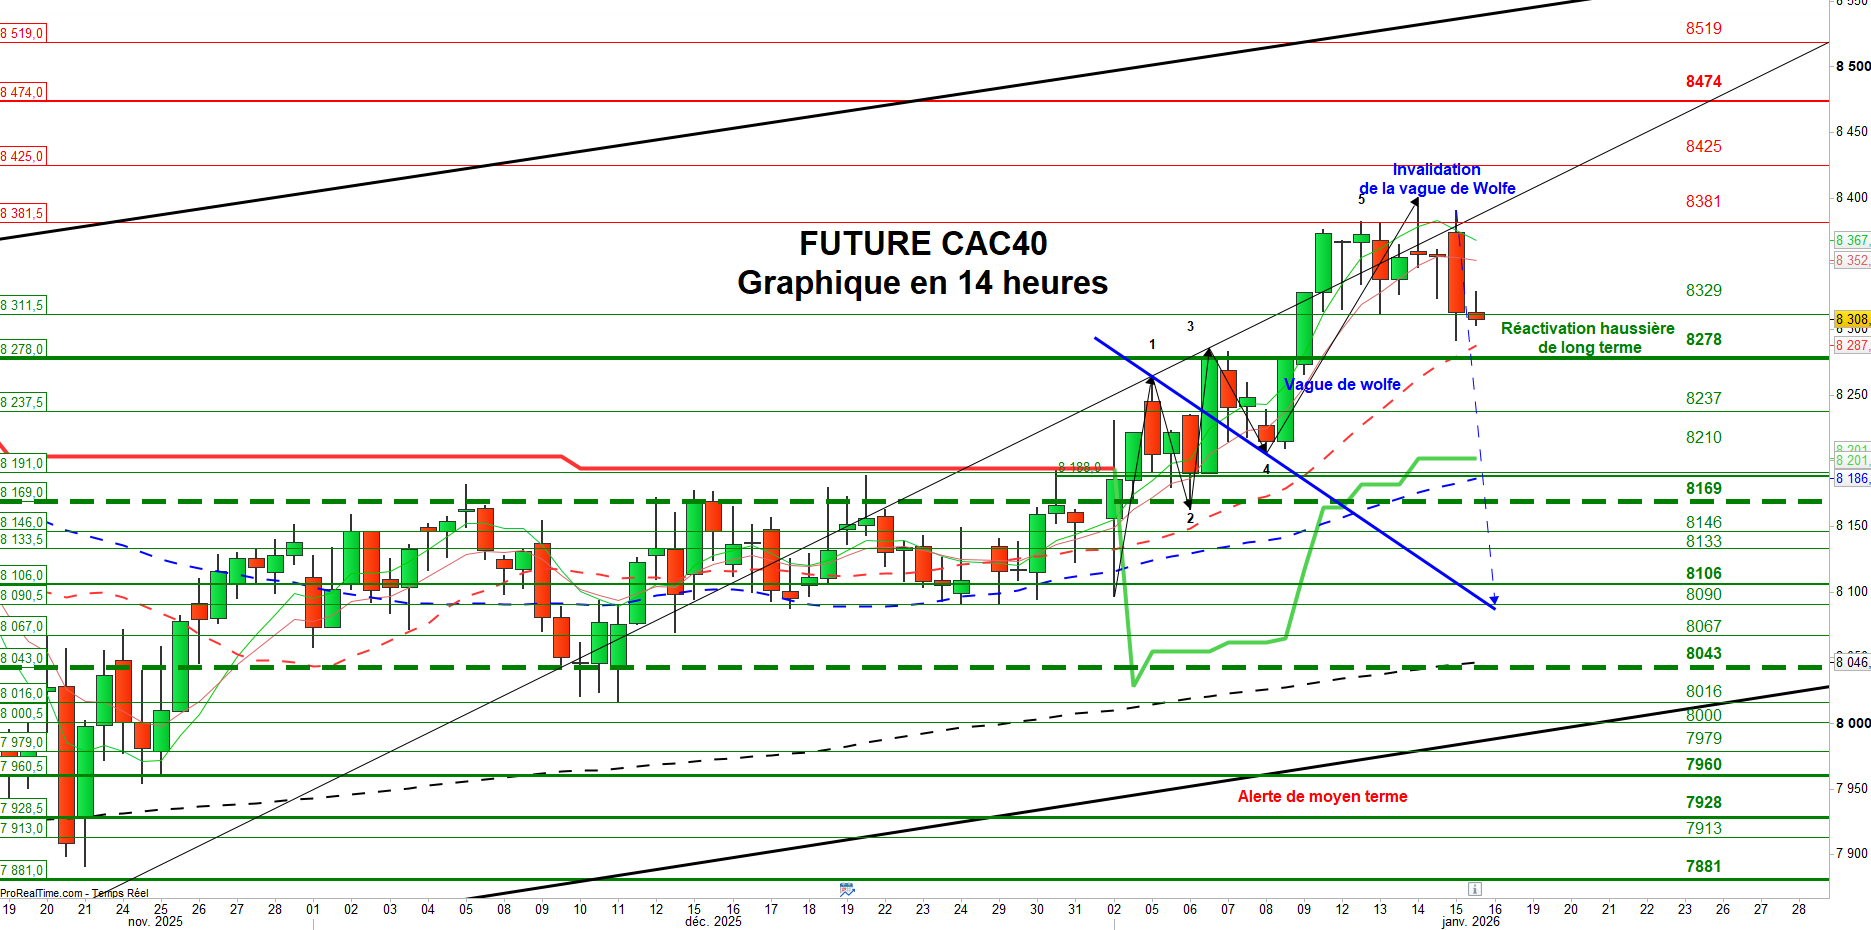
Technical levels – January future
Resistance zones: 8,381 → 8,425 → 8,474 → 8,519 → 8,540.
Support zones: 8,329 → 8,281 → 8,237.5 → 8,210 → 8,172.5 → 8,146 → 8,133 → 8,106 → 8,090 → 8,067 → 8,043 → 8,016 → 7,978 → 7,970 → 7,933 → 7,907 → 7,880.5 → 7,840 → 7,793.
Intraday bias turns bearish when the price falls below 8,377.
Chart narrative
The CAC 40 January future shows early‑session weakness after recently topping historic highs. A decisive break of a long‑standing resistance level that capped the market since March 2024 triggered a short‑term pullback. The price action suggests a consolidation phase, reinforced by the emergence of a Wolfe Wave reversal pattern.
The downside may be capped by two key zones: the bullish gap from 9 January around 8,259 (cash) / 8,281 (future) and the former resistance that now acts as support. If this area holds, the sell‑off could stay limited; a breach might open a path toward 8,169 and potentially down to the 8,100 region.
Momentum indicators
MACD histograms are contracting, while the RSI has retreated from overbought territory, both pointing to a waning upward thrust. Volume remains above the recent average, supporting the case for a modest correction.
Upside scenario
For the market to resume a clear bullish march, the Wolfe Wave would need to be invalidated by a decisive break and a close above the evolving trend line near 8,380 points. That could reignite the long‑term uptrend, aiming for the upper band of the long‑term channel around 8,470‑8,500.
Strategy note: The recent Wolfe Wave detection prompted a reduction of exposure in the Dynamic portfolio and a hedge in the Investor portfolio via a BX4 purchase, limiting downside risk while awaiting confirmation of the pattern before considering new short positions.