
Which Gulf ETFs May Shine After the Conflict?
Two months of fighting have passed. It is a good time to check the U.S.-listed Gulf ETFs and see if any could benefit from a calm period. The four funds are:
- iShares MSCI Saudi Arabia (KSA)
- iShares MSCI Kuwait (KWT)
- iShares MSCI Qatar Capped (QAT)
- iShares MSCI UAE Capped (UAE)
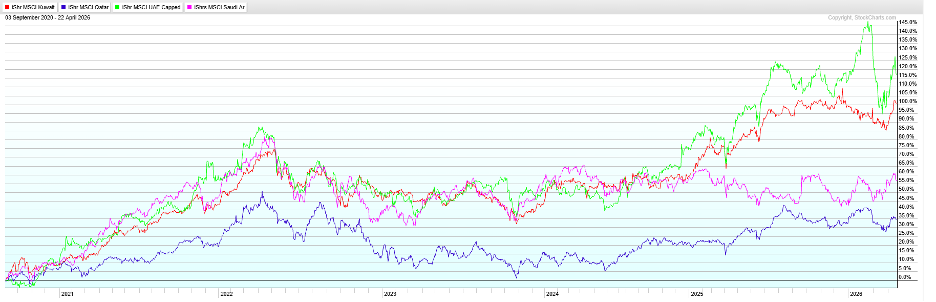
Over the last 1,300 days, the UAE fund has led the pack, followed by Kuwait. Past performance helps us guess what could happen next, so let’s look at each fund alone.
The Nirvana Template
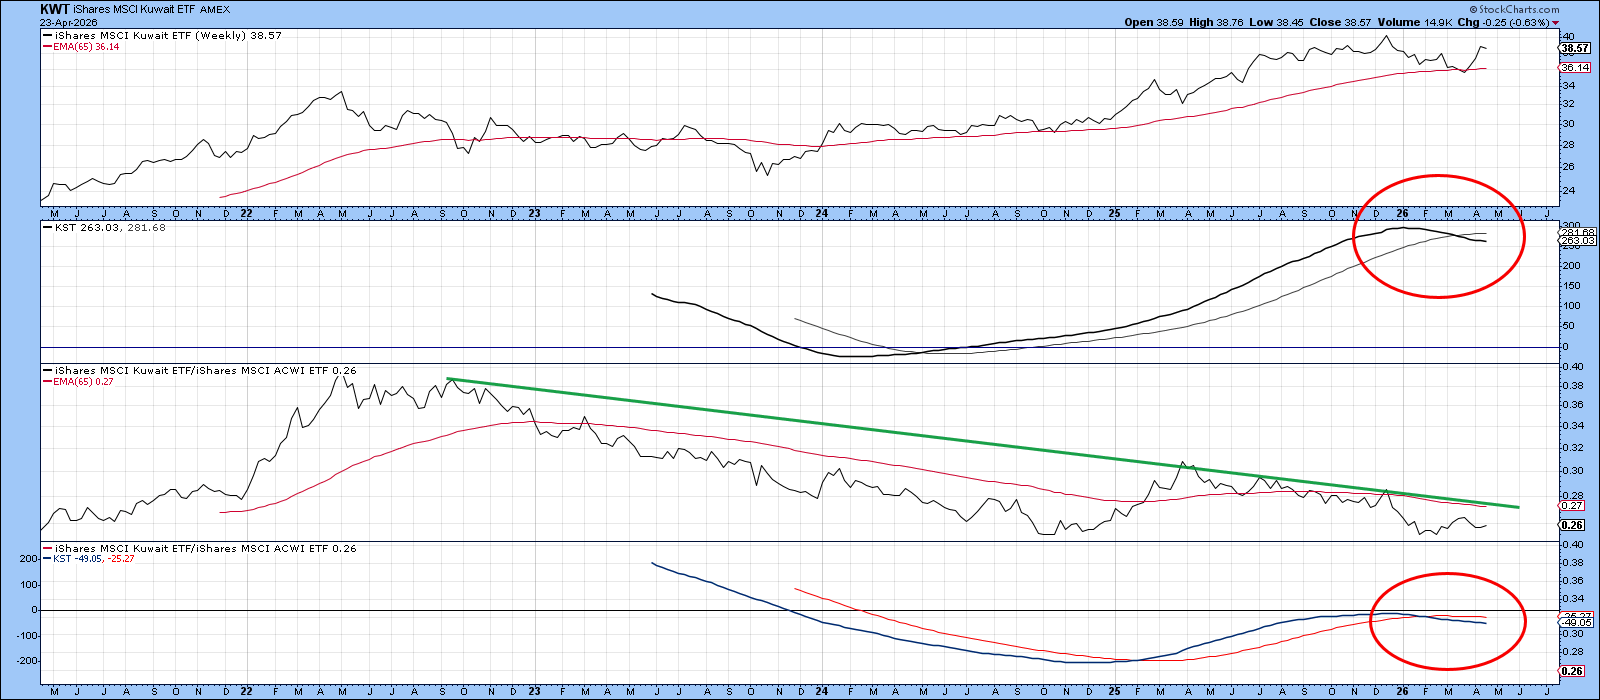
I use a special chart style called the Nirvana Template. It checks four things: the overall trend, the relative trend, and two long‑term momentum lines (KST). When all four are pointing up and sit above their 65‑week averages, the market is in a “Nirvana” state – a strong sign of a good buying chance.
Kuwait (KWT)
KWT has moved sideways for a few years. Its relative‑strength line has been falling since 2022 and is well under the 65‑week average. Two KST signals also tell us to sell. All this makes KWT look weak.
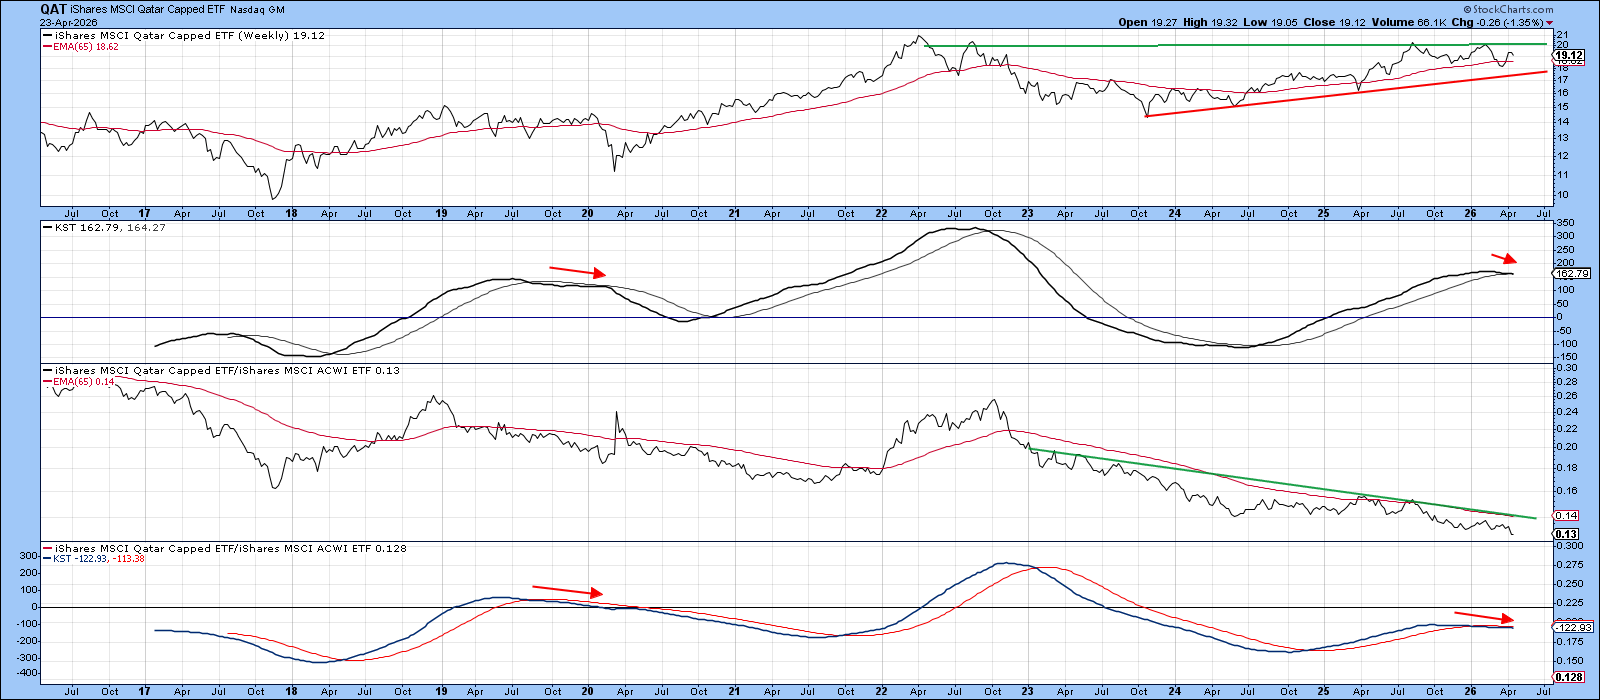
Qatar (QAT)
QAT trades in a wider range than KWT. Its strength line is also slipping. A clearer upside would need the price to break above the 65‑week average and the green down‑trend line.
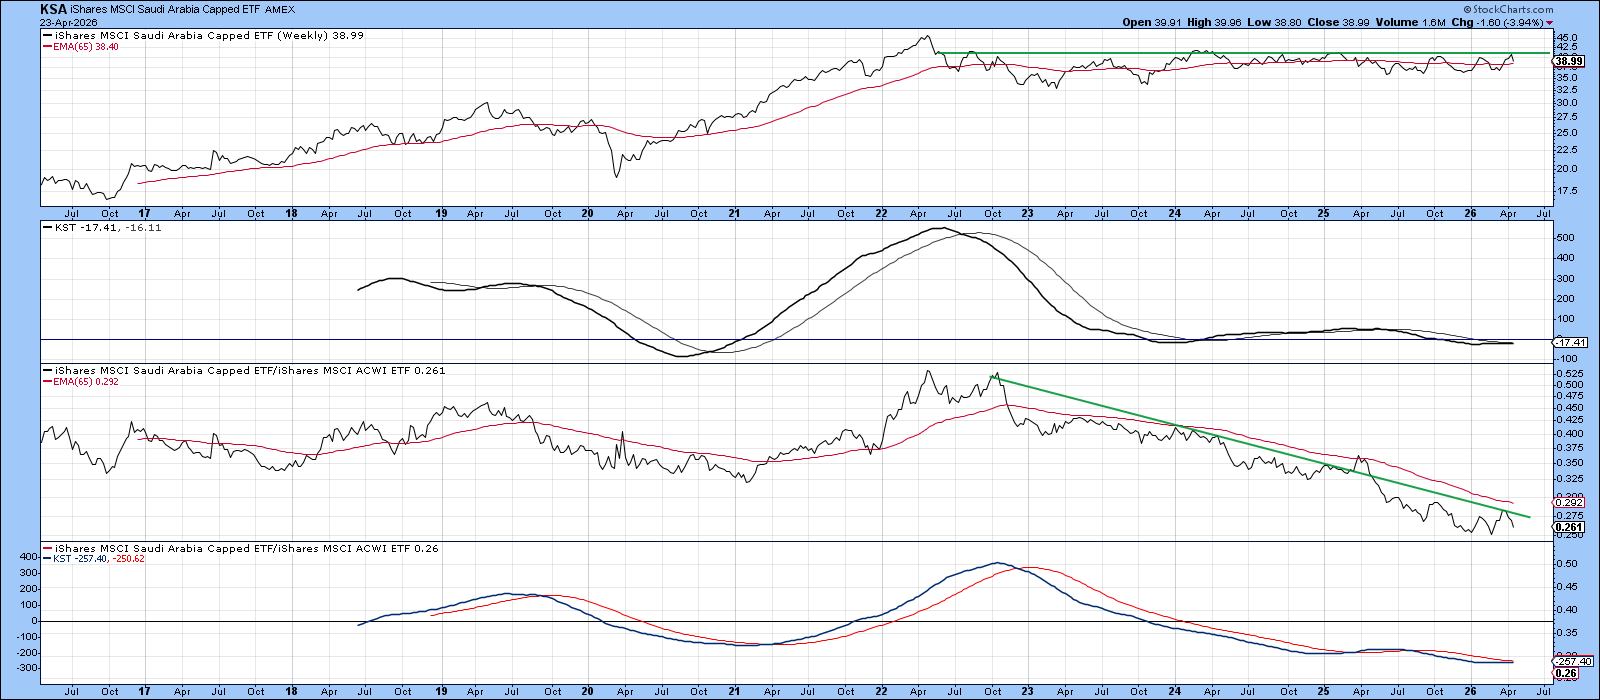
Saudi Arabia (KSA)
KSA also sits in a range, but its technical picture looks a bit stronger. Both momentum lines have leveled out and are starting to firm up. The strength line has been flat for six months. A solid rally above the green resistance line could improve the outlook.
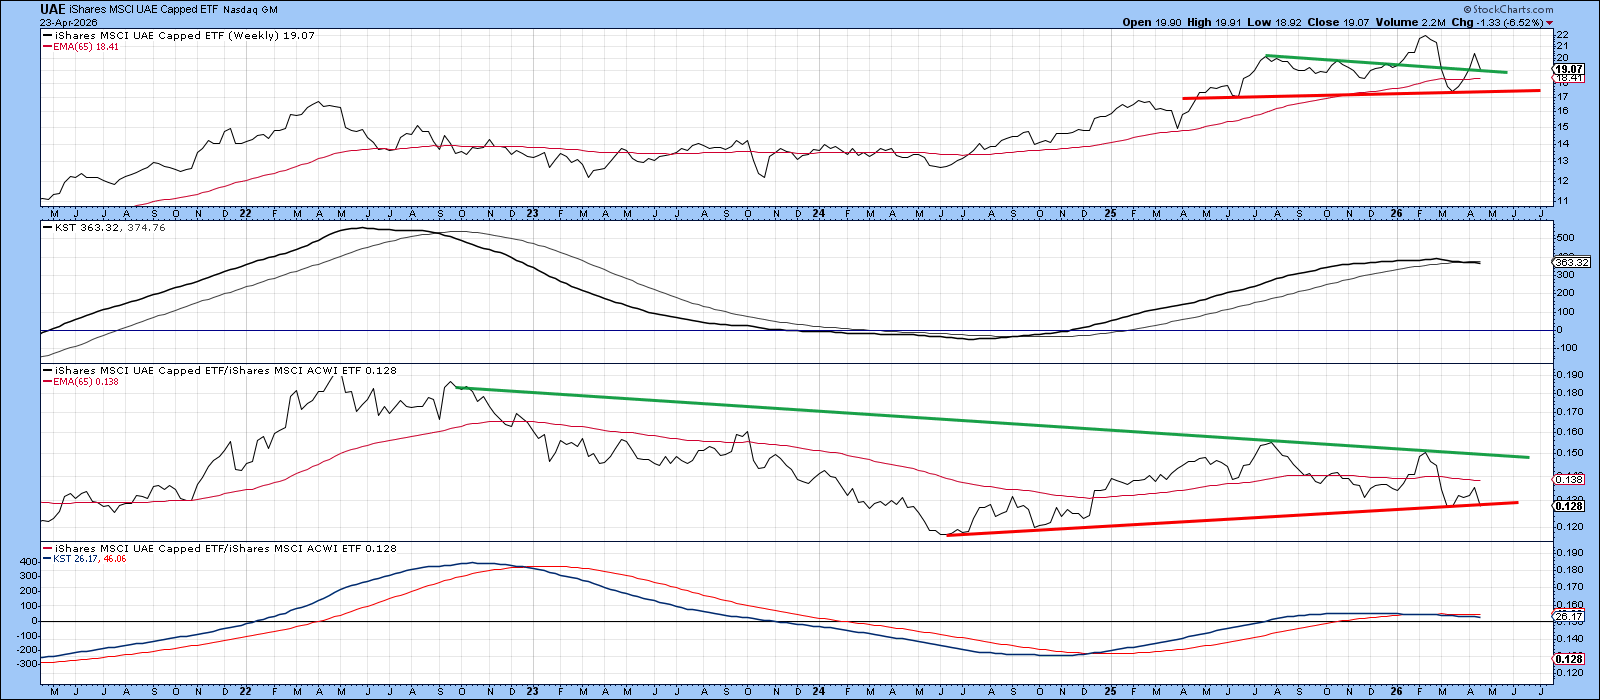
United Arab Emirates (UAE)
UAE has been the best performer, but the lead may be fading. Both KST lines are starting to turn down, and the strength line sits close to the neck of a possible head‑and‑shoulders pattern. A break below that neck would hurt the technical picture.
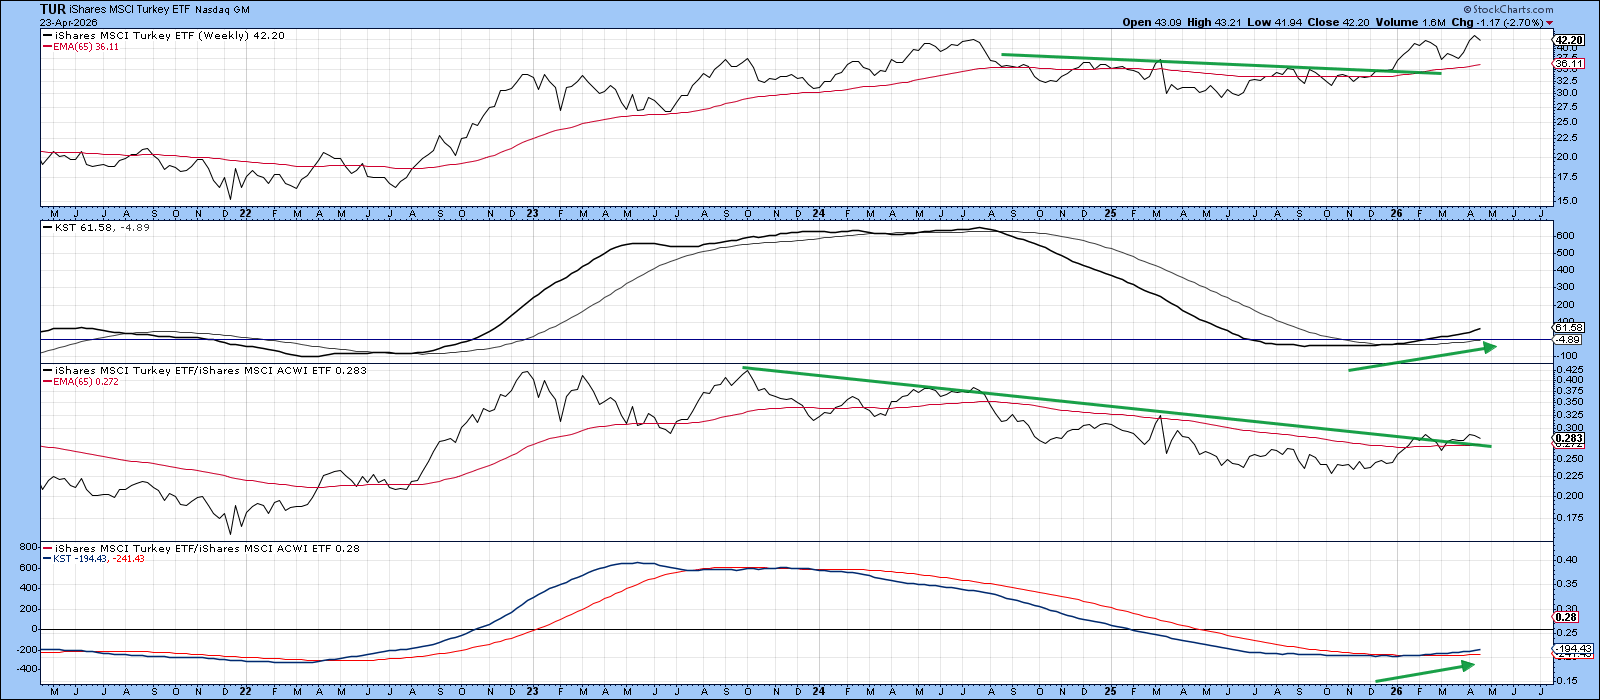
Turkey (TUR)
Although Turkey is not a Gulf country, it is nearby and worth watching. The price dropped when the war started but has since climbed to a new high. The strength line is nudging higher, and both long‑term KSTs have turned sharply up, showing strong momentum.
Bottom Line
Most Gulf ETFs are moving sideways. That does not look like markets getting ready for a big economic shock. At the same time, investors are not betting on a quick end to the fighting. The charts show a neutral tone – neither very hopeful nor very worried. Looking north to Turkey, the picture appears a bit brighter.
Happy charting!
Source: Materials provided by https://articles.stockcharts.com.Note: Content may be edited for style and length.